
Hi everyone, I host a server with few services running for my family and friends. The server freezes sometimes. Where the services stop responding. If I try to ssh into the server, it takes a lot of time (3 to 5 mins) for it to connect. After being connected, every letter I type takes 2 to 3 mins to appear on screen.
Seems like the server is overloaded with tasks. But I am not sure what load it is running. I have netdata installed. I could pull up following screenshots for insights.
Can someone please help me in troubleshooting the issue?
I have tried testing stress testing my RAM and CPU, and they were fine. But I would start troubleshooting from scratch if you have recommendations for testings softwares.
Please also let me know if there is anything I can pull from netdata to help in trouble shooting.
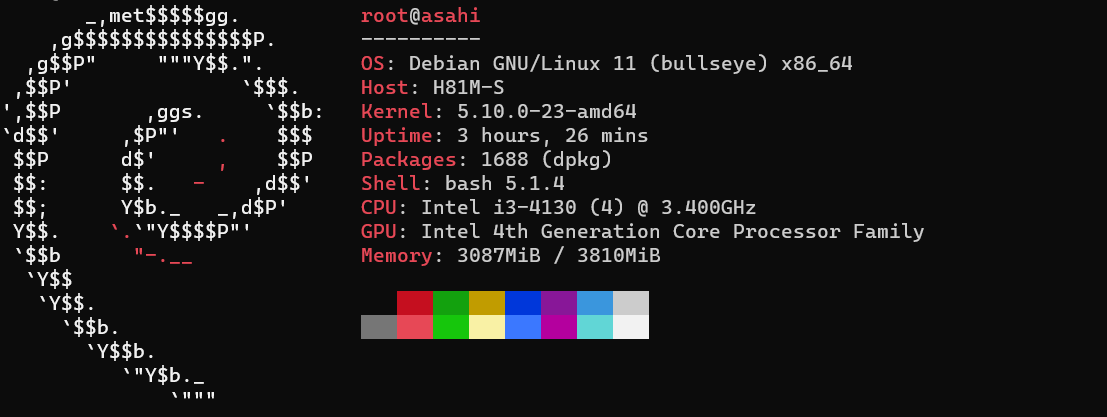
System Specification:
System RAM

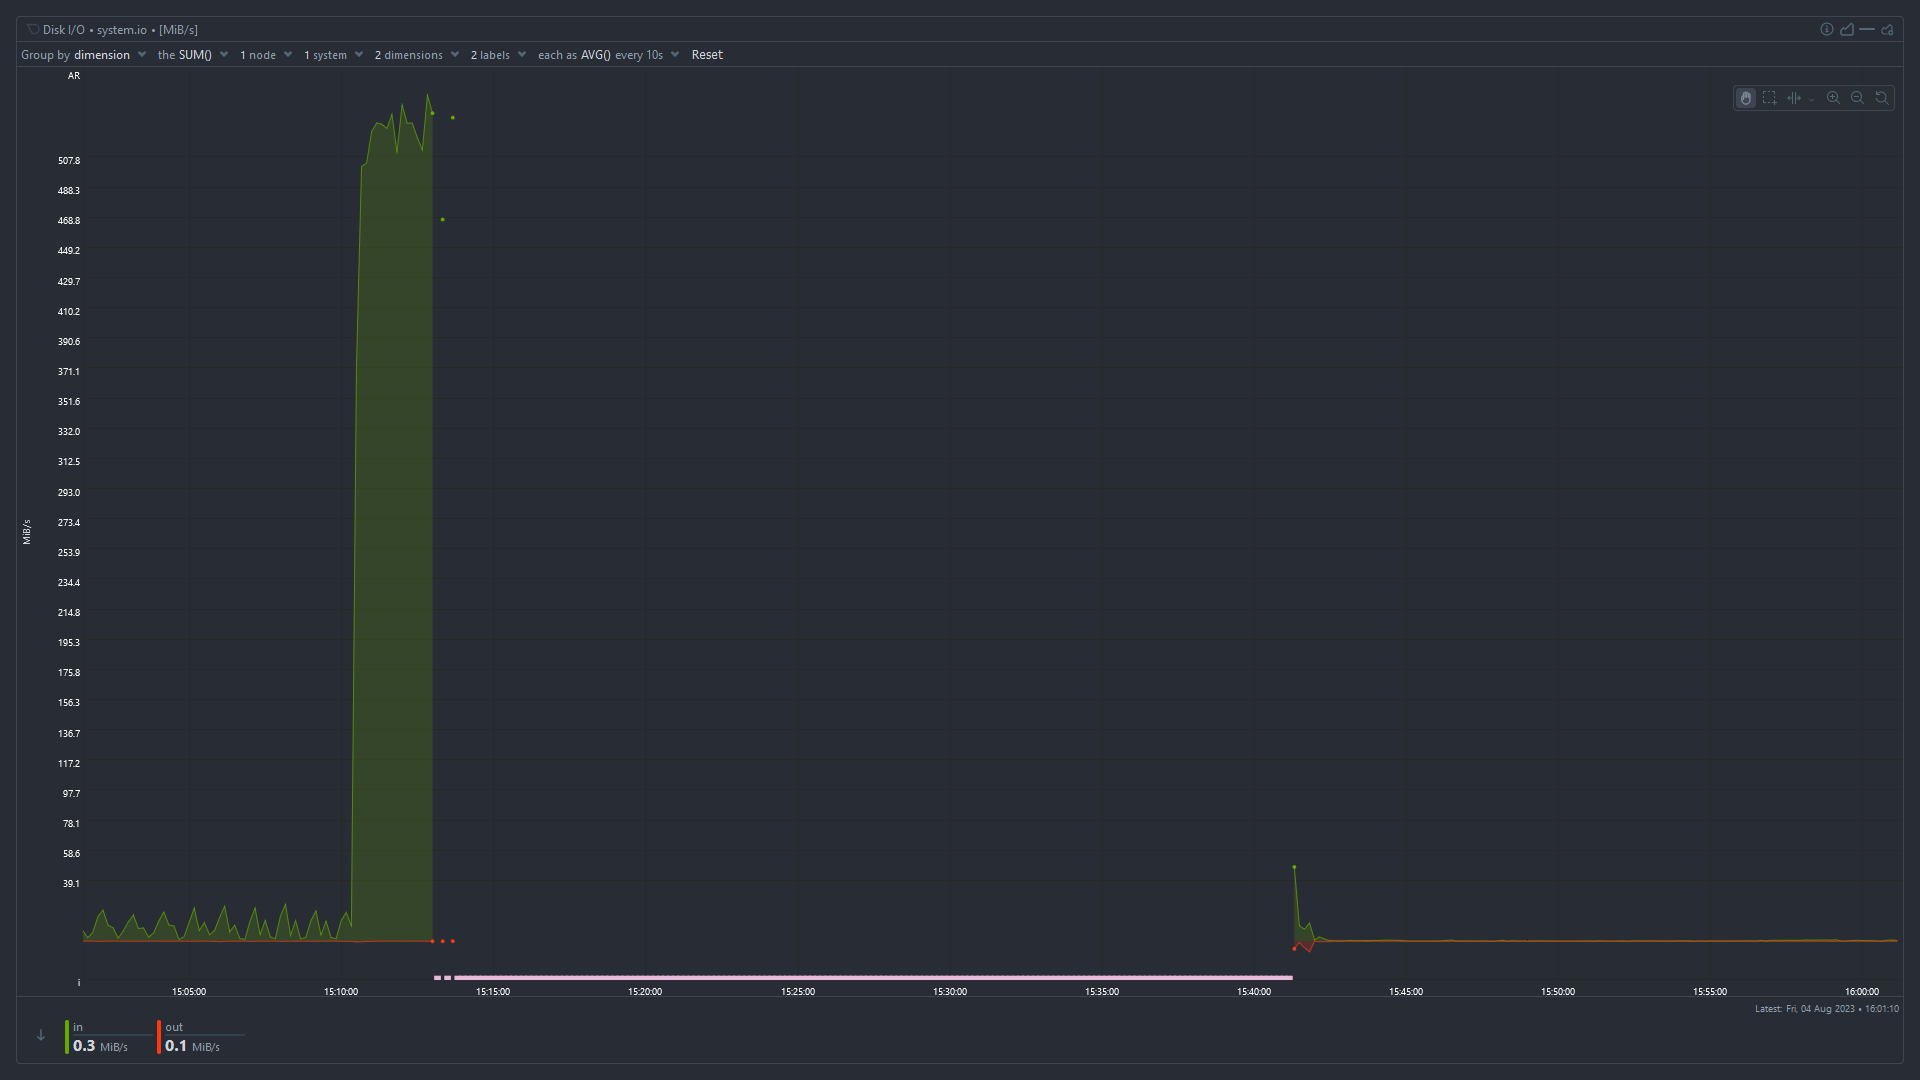
Disk I/O
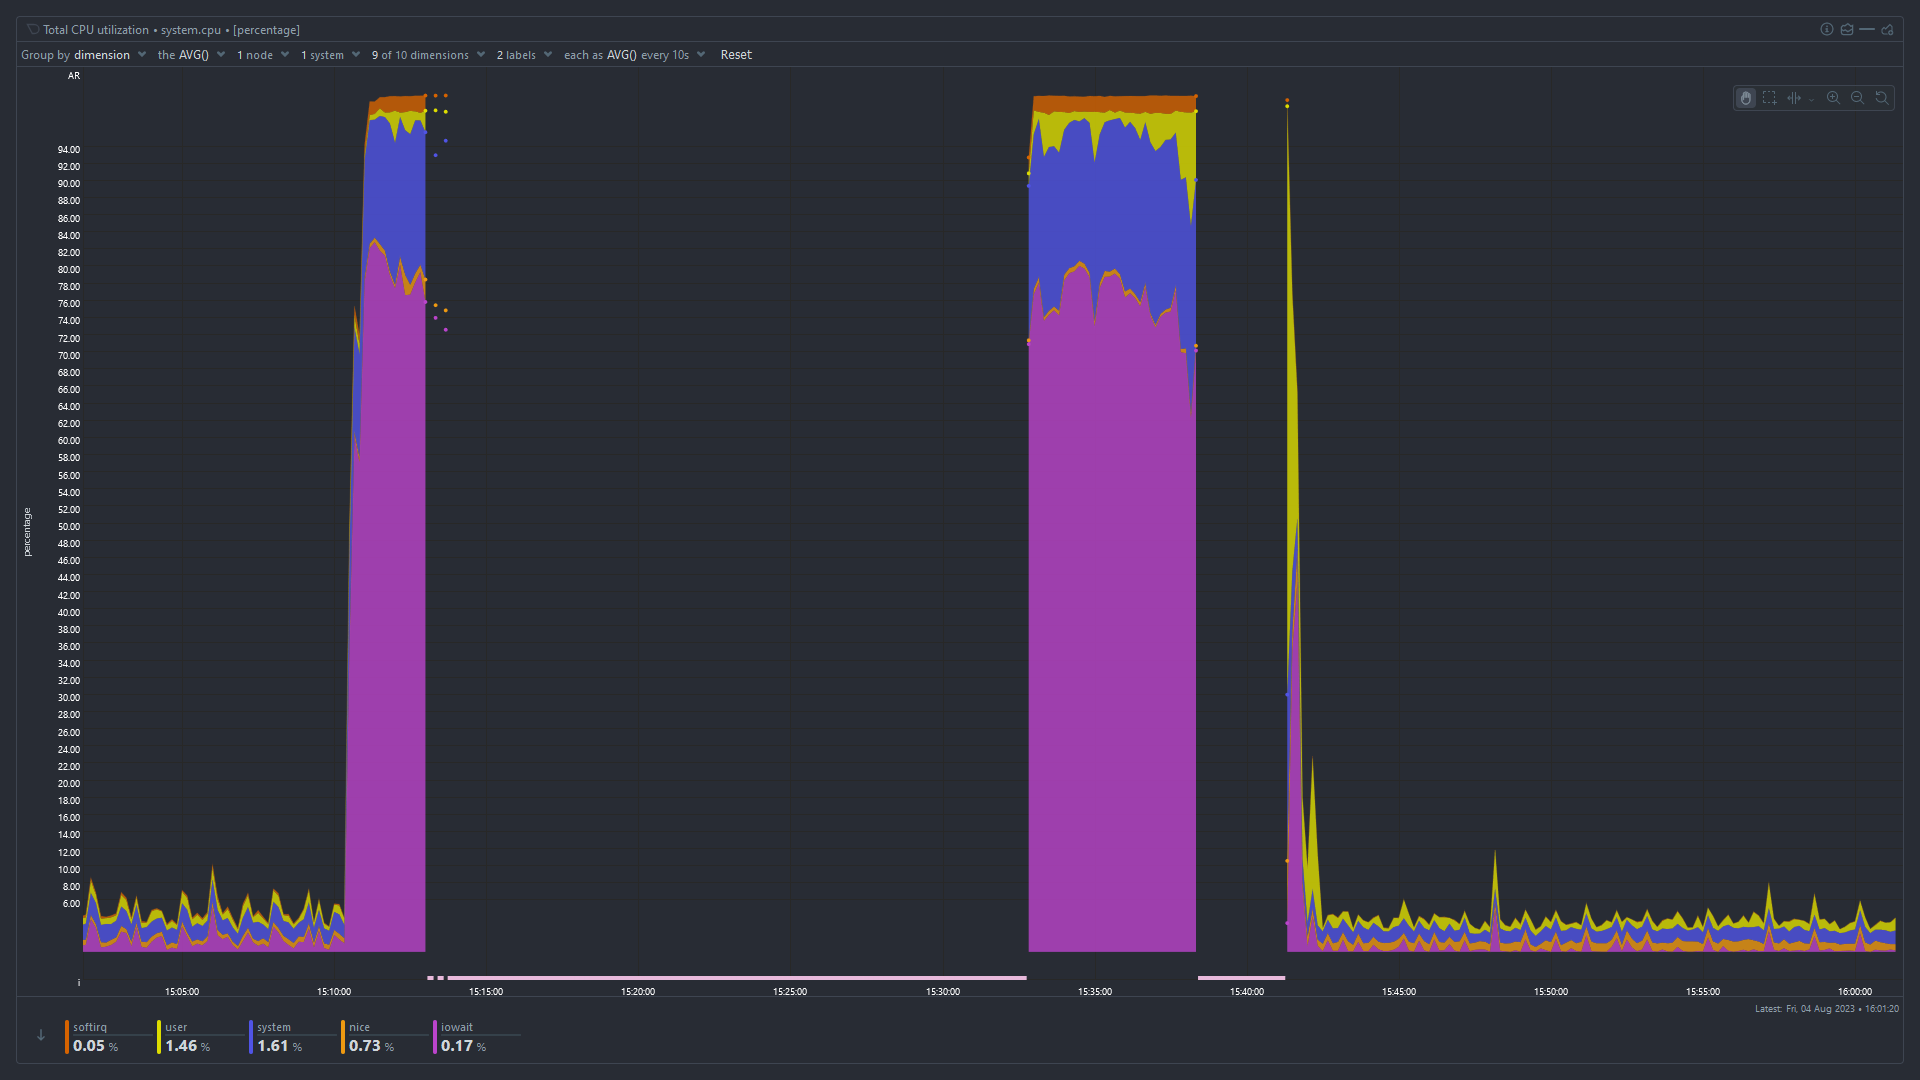
Total CPU Utilization
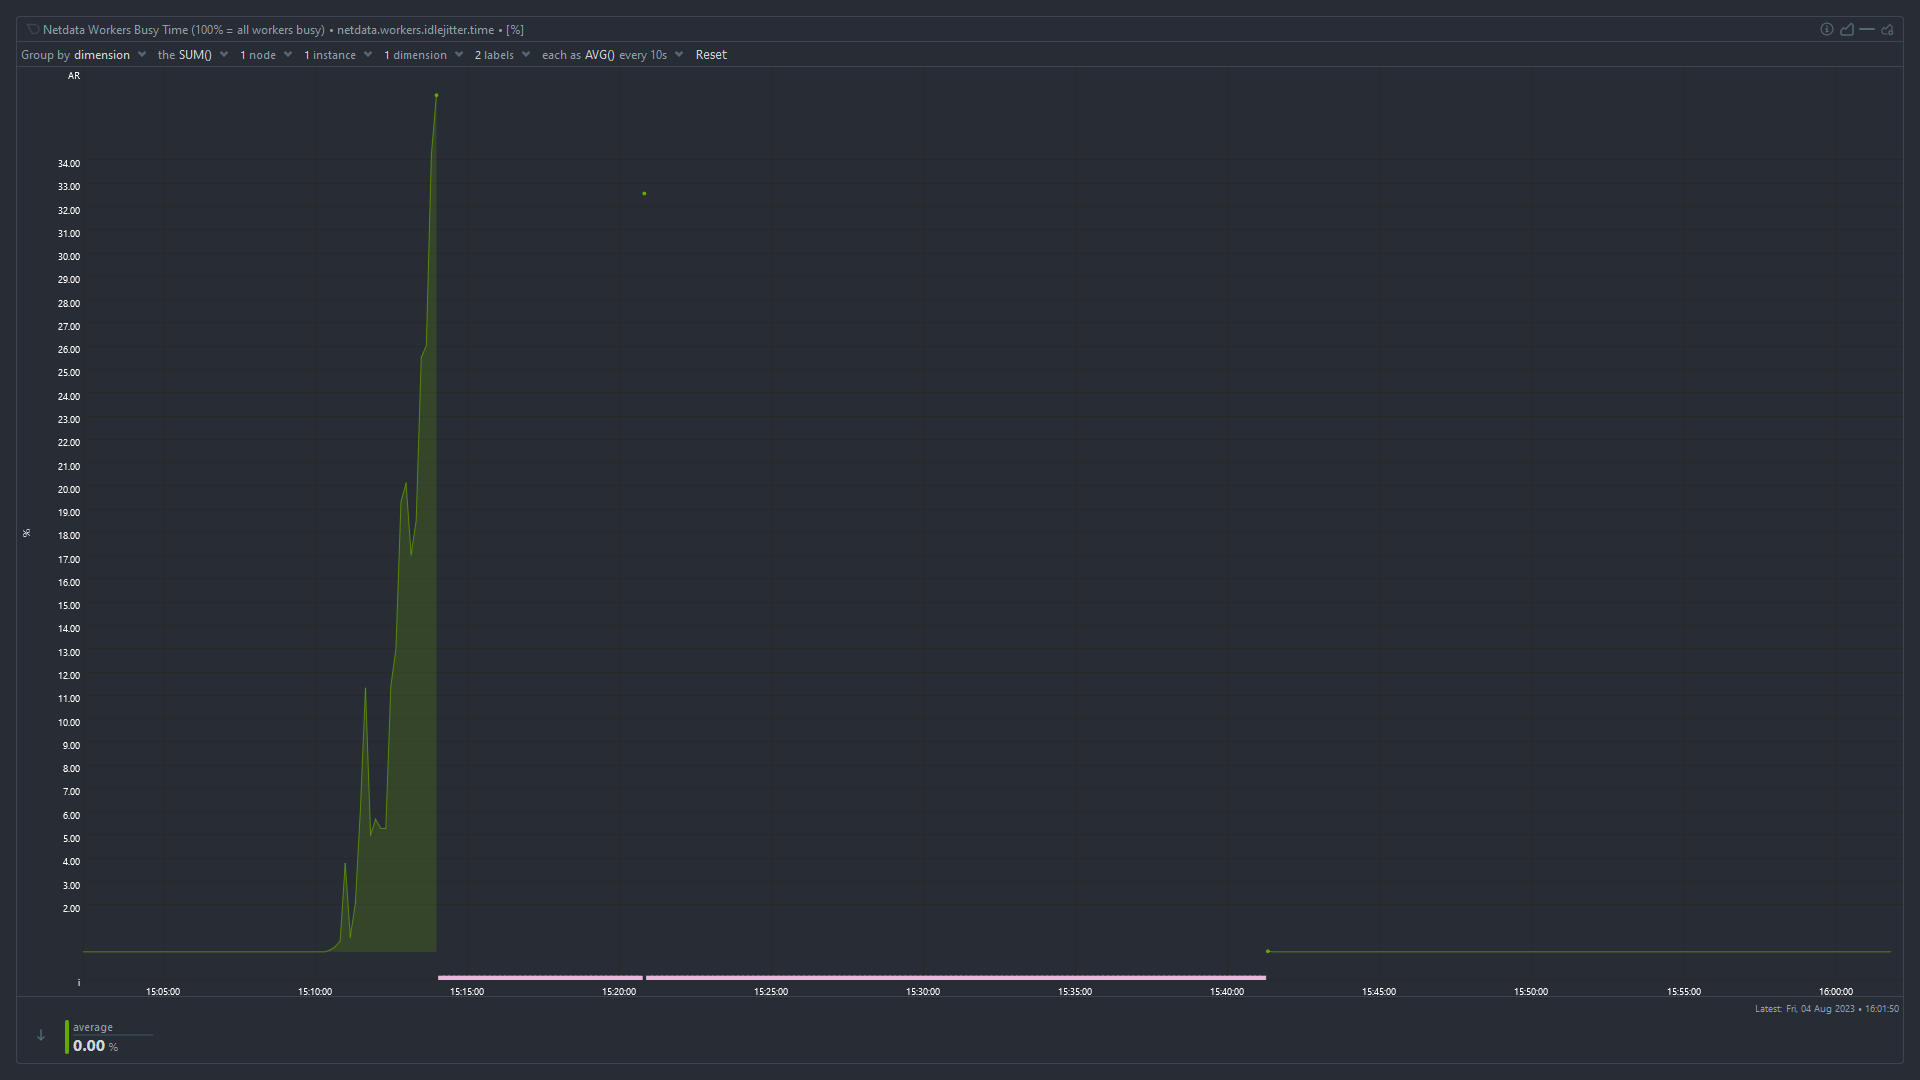
Idle Jitter
You must log in or register to comment.
High iowait and high used memory suggest that something has used up all the available memory and the system is swapping like mad to stay alive. I’m surprised the OOMKiller hasn’t intervened at that point.
You need to monitor which process is using all the memory. The easiest way is probably to keep
htoprunning in ascreenortmuxsession, periodically connect, and look at which processes have the highest used memory.. The easiest way is probably to keep htop running in a screen or tmux session, periodically connect, and look at which processes have the highest used memory.
The easiest way is to disable swap and then see what is killed by the OOM killer.
I don’t see a clear indication that you have too low RAM… RAM should be “used” fully at all times and your “cached” RAM value suggest you still have quite a bunch of RAM that could potentially be consumed by applications when they need it.
I cannot clearly see a swap usage in the graphs - that would be an interesting value to judge the overall stability of the system with regards to fluctuating RAM usage.However, once you notice the problem again, right after you manage to log in, run a “dmesg -T | grep -i oom” and see if any processes get killed due to temporarily spiking RAM consumption. If you’re lucky that command might lend some insight even now still.
Also, what if you run a “top” command for a while, what’s the value for “wa” in the second line like? “wa” stands for I/O wait and if that value is anything above 5 it might indicate that your CPU is being bottlenecked by for instance hard disk speed.
